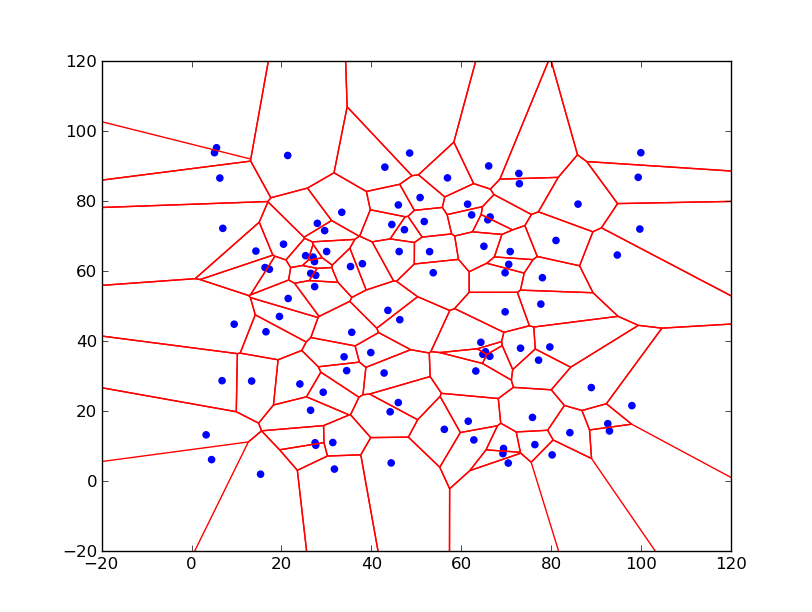
Some time ago I was looking for an algorithms that can generate a ‘map like’ like pictures – e.g. tessellation of a plane into set of more or less random polygons. I found Voronoi diagrams – which give very nice pictures and have many useful properties.
Most common case of Voronoi diagram is known in an Euclidean plane, where we have a set of points (call seeds) then Voronoi diagram splits the plane into areas – called Voronoi cells – around each seed, where inside each area any point is closer to that seed then to any other. Areas are then convex polygons (for Euclidean metric). This definition is best illustrated on the picture below – the Voronoi diagram for 100 random points in range 0-100 – Voronoi cells are marked by red lines, blue points are seeds:
